Homeowners insurance protects your home, belongings, and even liability if someone is injured on your property. But how often do homeowners actually file claims, and what types of damage are most costly? Understanding homeowners insurance claims statistics can help you make informed decisions about coverage, risk prevention, and long-term planning.
In this guide, our team at HealthsureHub compiled the top 10 homeowners insurance claims statistics, analyzed the most common causes of loss, explored claim severity, and offered actionable insights to help homeowners protect their investments.
Top 10 Homeowners Insurance Claims Statistics
- 5.6% of home insurance policy holders file a claim each year, meaning roughly 1 in 18 insured homes reports a loss.
- Property damage accounts for 96–98% of all homeowners insurance claims, far exceeding liability or miscellaneous claims.
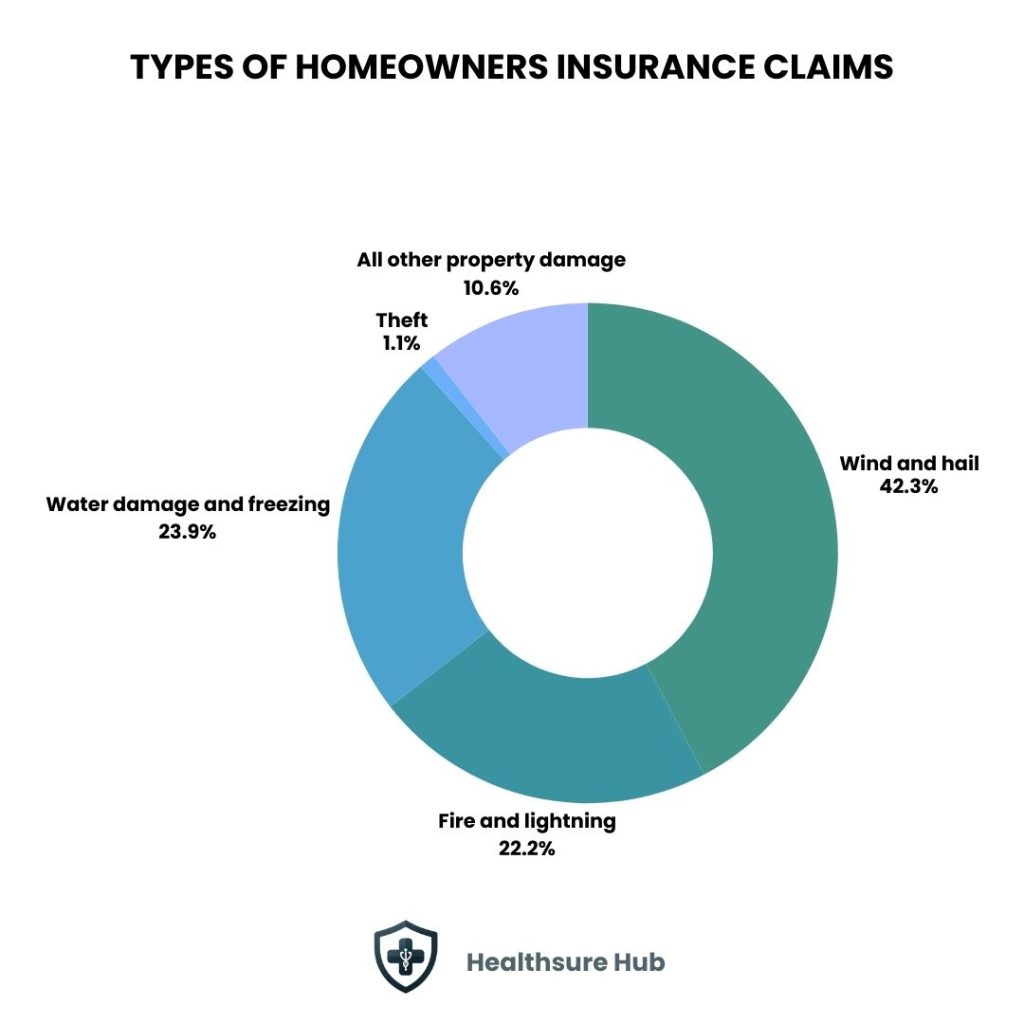
- Wind and hail damage are the most frequent claims, affecting 1 in 36 homes annually.
- Water damage and freezing claims impact approximately 1 in 67 insured homes each year.
- Fire and lightning are less frequent but extremely expensive, with 1 in 430 homes filing such claims annually.
- Average homeowners insurance claim cost: ~$17,059, with liability claims averaging $29,880.
- Lightning claims in 2024 totaled over $1 billion in payouts, a 16.5% decrease from 20243.
- Catastrophe claims contributed 42% of total homeowner losses in 2024, reflecting increasing severe weather events.
- Texas reported the highest average lightning claim ($38,000+), highlighting regional risk differences.
- Industry data shows approximately 5–6% of all homeowners insurance claims are fully denied.
These homeowners insurance claims statistics demonstrate that weather and property-related perils dominate homeowners insurance claims, while liability claims, although less frequent, can be costly.
How Much Do Homeowners Claims Cost?
While some claims happen frequently, others are rare but financially devastating. Severity measures the average payout per claim.
| Cause of Loss | Average Claim Cost (USD) | Frequency | Notes |
| Fire & Lightning | $88,170 | 1 in 430 | Most expensive per claim |
| Water Damage & Freezing | $15,400 | 1 in 67 | Sudden leaks and burst pipes |
| Wind & Hail | $14,747 | 1 in 36 | Most frequent claim |
| Liability (Bodily Injury/Property) | $37,174 | 1 in 830 | High-cost but rare |
| Theft | $5,524 | 1 in 190 | Less severe claims |
| Credit Card Fraud & Other | $16,080 | 0.5% | Fraud and miscellaneous losses |
| Guest Medical Payments & Liability | $11,886 | 0.3% | Covers injuries to visitors |
| Overall Average | $17,059 | — | Includes property + liability |
On average, across all categories, the average homeowners insurance claim costs approximately $17,000. However, this number masks wide variation. Fire and lightning claims are rare but financially significant. Liability claims are less frequent but can also strain your insurance coverage if not adequately planned.
Understanding Homeowners Insurance Claim Frequency
Claim frequency tells us how often homeowners experience losses that lead to insurance claims. It helps both homeowners and insurers assess risk.
Filing a homeowners insurance claim isn’t always a guarantee of payment. While most claims are approved, industry data shows that around 5–6% of all homeowners insurance claims are fully denied. Water damage claims, in particular, face one of the highest risks of denial, meaning nearly 1 in 10 can be rejected, often because the damage was gradual or tied to maintenance issues.
Even more striking, in some areas like Texas, nearly half of homeowners’ claims were closed without any payout in 2024. That doesn’t necessarily mean insurance companies are being unfair. Sometimes the damage falls outside the policy, or documentation is missing, but it highlights why understanding your coverage and maintaining your home is so important.
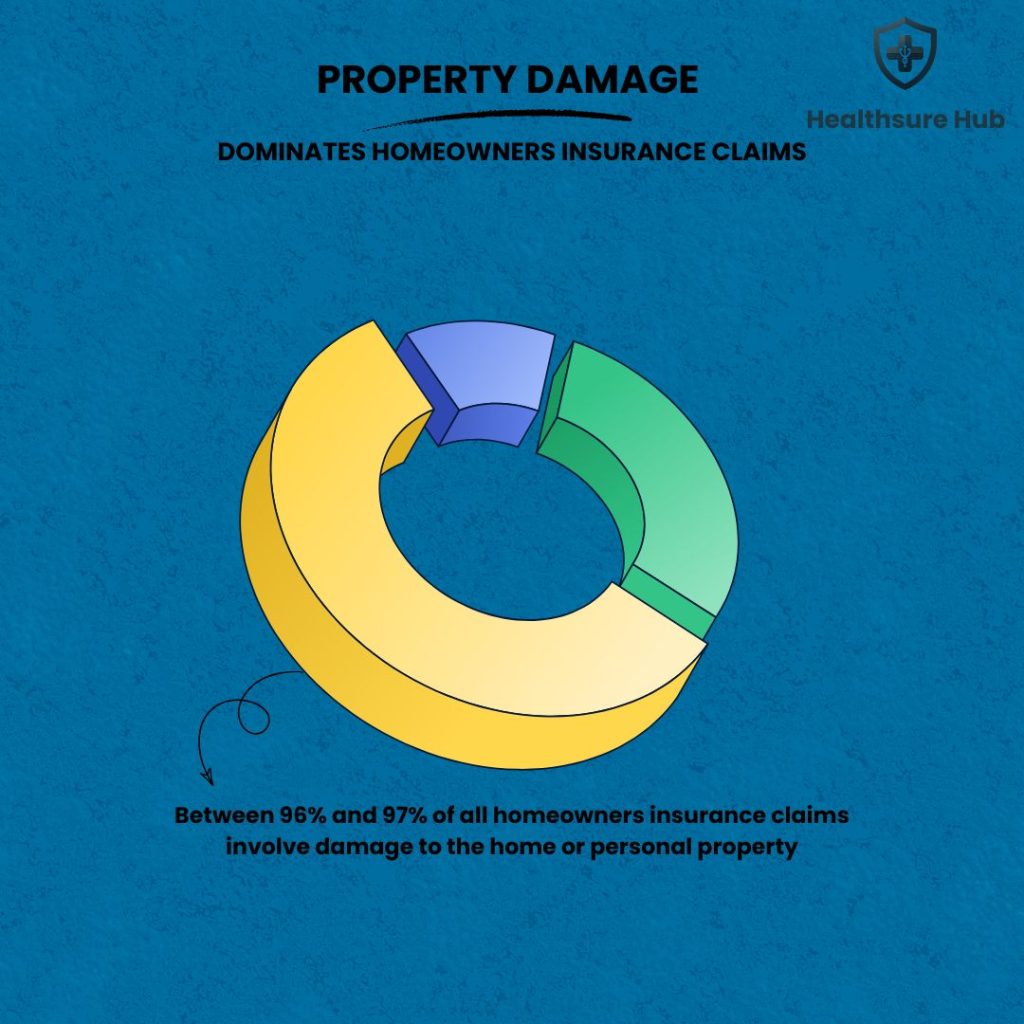
Property Damage Dominates Homeowners Insurance Claims
When looking at homeowners insurance claims statistics, one trend stands out clearly: property damage claims dominate the landscape.
Between 96% and 97% of all homeowners insurance claims involve damage to the home or personal property. This mirrors broader trends across the property and casualty insurance market, where property losses drive the majority of claim volume. Liability-related claims account for only a small fraction, while niche categories like credit card fraud make up less than 1%.
This heavy skew toward property damage explains why weather patterns, construction costs, and home maintenance play such a critical role in insurance risk.
Wind and Hail Damage: The Most Common Cause of Claims
Wind and hail damage consistently ranks as the most frequent homeowners insurance claims statistics.
On average:
- About 1 in 36 insured homes files a wind or hail claim each year
- These losses represent more than 40% of all homeowners insurance claims
Severe thunderstorms, hurricanes, tornadoes, and straight-line winds all fall under this category. Roof damage, siding loss, broken windows, and structural stress are among the most common outcomes.
Although these homeowners insurance claims occur often, their average cost—around $14,700 per claim—is lower than some other categories. However, frequent wind events can still drive premium increases over time.
Water Damage and Freezing: A Quiet but Costly Risk
Water damage is the second most common cause of homeowners insurance claims, and it often catches homeowners by surprise, as per homeowners insurance claims statistics.
Roughly 1 in 67 homes files a water damage or freezing claim each year, accounting for about 24% of all homeowners insurance claims.
Common causes include:
- Burst pipes
- Appliance failures
- Plumbing leaks
- Ice-related pipe damage
Unlike floods, which are excluded from standard policies, these losses are typically covered if they occur suddenly. The average water damage claim costs around $15,400, reflecting the high cost of repairs, mold remediation, and interior restoration.
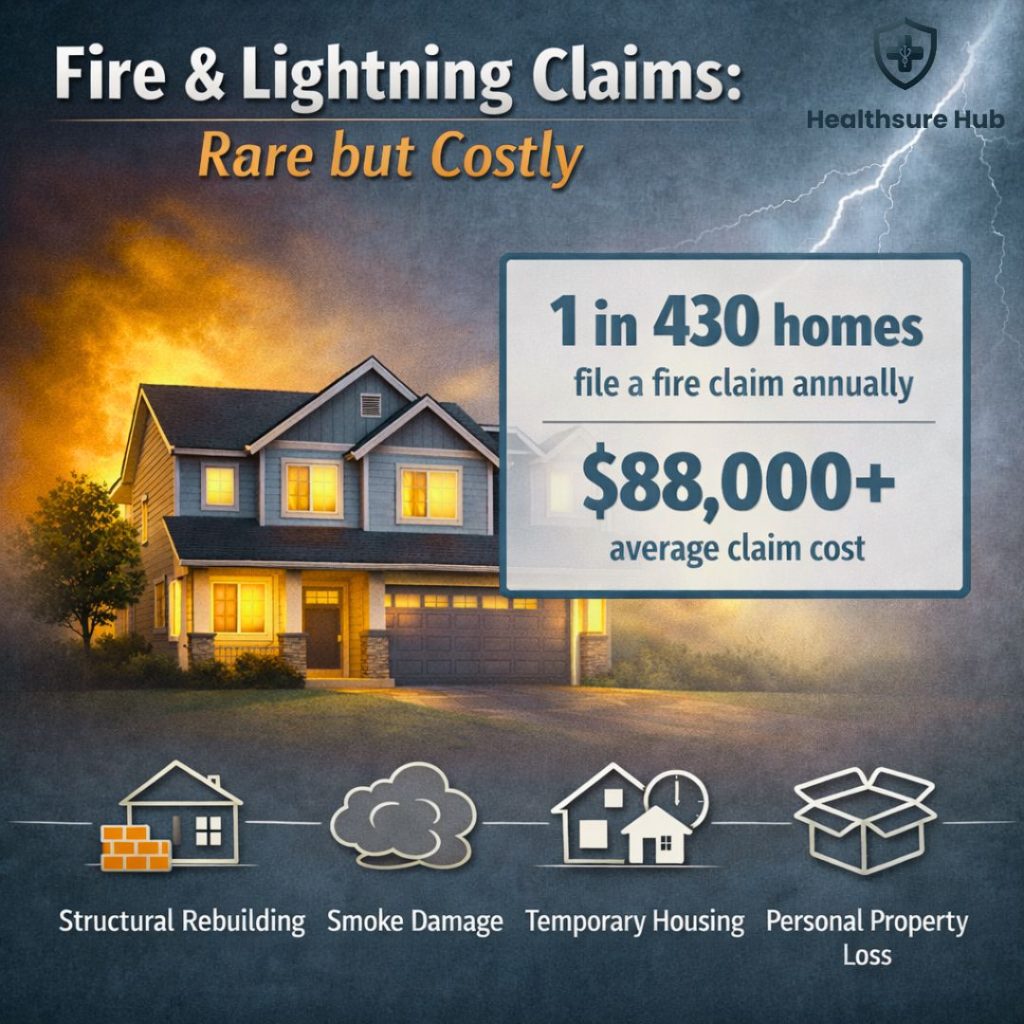
Fire and Lightning Claims: Rare but Financially Devastating
Fire and lightning damage occurs far less frequently than storm or water losses, yet it remains the most financially severe category in homeowners insurance claims statistics.
Only about 1 in 430 insured homes files a fire-related claim each year. Despite this low frequency, the average claim exceeds $88,000, far surpassing all other loss types.
Fire losses often involve:
- Structural rebuilding
- Smoke damage remediation
- Temporary housing expenses
- Total loss of personal property
These claims highlight how quickly a single event can result in life-altering financial consequences.
Other Property Damage Claims That Add Up
Beyond wind, water, and fire, homeowners also file claims for other types of property damage. This category includes vandalism, malicious mischief, and accidental damage not tied to weather or plumbing.
Although these claims represent only about 8% of homeowners insurance claims, they still contribute significantly to overall loss totals. Their average severity is lower, but frequency varies widely by location.
Theft Claims Are Less Common Than Expected
Despite popular perception, theft is one of the least frequent homeowners insurance claims. Nationwide, homeowners insurance claims statistics state that theft represents less than 1% of homeowners insurance claims.
Improved home security systems, neighborhood awareness, and smart technology have helped reduce both the frequency and severity of theft-related losses.
Claims That Close Without a Payout
One under-discussed aspect of homeowners insurance claims statistics is how often claims close with no payment.
A noticeable portion of filed claims—particularly water damage claims—are denied or resolved without reimbursement. Common reasons include:
- Damage caused by long-term wear and tear
- Maintenance-related issues
- Excluded perils
- Insufficient documentation
These outcomes reinforce the importance of understanding policy terms and maintaining the home proactively. Some no-payout claims are also tied to suspected misrepresentation or fraud, a growing issue across the insurance industry.
Why These Homeowners Insurance Claims Statistics Matter
Statistics aren’t just abstract numbers. They reflect real-world risks faced by homeowners every day.
Understanding homeowners insurance claims statistics helps homeowners:
- Recognize their most likely risks
- Prioritize preventive maintenance
- Set realistic expectations for coverage
- Make informed decisions about deductibles and policy limits
The data consistently shows that weather-related damage and water losses dominate claims, while fires and liability events drive the highest costs.
Conclusion
Homeownership comes with responsibility, but it also comes with exposure to risk. By understanding how often claims occur, what causes them, and how costly they can be, homeowners are better equipped to protect both their property and financial stability.
As per the homeowners insurance claims statistics, these are not rare events, but a normal part of owning a home. Staying informed is one of the most effective ways to reduce surprises when it matters most.
Sources:
https://www.dicklawfirm.com/blog/2025/april/what-percentage-of-homeowners-claims-are-denied-
https://www.iii.org/fact-statistic/facts-statistics-homeowners-and-renters-insurance
https://www.usnews.com/insurance/homeowners-insurance/most-common-claims
https://www.usnews.com/insurance/homeowners-insurance/most-common-claims
https://ieeexplore.ieee.org/document/10046729
https://www.dalyblack.com/why-insurance-companies-are-not-paying-claims/
https://www.linkhellmuthinsurance.com/5-most-common-home-insurance-claims/
https://www.frizzlife.com/blogs/guide/water-damage-insurance-what-homeowners-insurance-covers