Every year, millions of car accidents, fender-benders, and weather-related incidents send U.S. drivers to their insurance companies. Some with minor dents, others with claims that cost tens of thousands of dollars. But behind every payout is a story hidden in the numbers and patterns like insurance fraud that also drive higher costs. Understanding auto insurance claims statistics isn’t just about dollars and cents ;it’s about uncovering patterns in accidents, driver behavior, and risk that shape the cost of insurance for everyone on the road.
Whether you’re a policyholder seeking clarity on your premiums or an insurer aiming to price risk more accurately, these insights uncover the forces driving today’s auto insurance landscape.
Auto Insurance Claims Statistics Overview
In the U.S., millions of auto insurance claims are filed annually. In 2024, an estimated 16.5 million claims were submitted, encompassing collision, bodily injury, property damage, and comprehensive coverage. While the majority of claims as stated by the latest auto insurance claims statistics are related to property damage and collisions, bodily injury claims remain the most expensive per incident.
Liability Claims: Bodily Injury and Property Damage
Liability insurance protects policyholders from financial responsibility for injuries or property damage caused to others. In 2024, 0.80% of liability policyholders filed a bodily injury claim, while 2.50% filed a property damage claim. While auto insurance claims statistics are frequent, property damage claims are more frequent, bodily injury claims are substantially costlier.
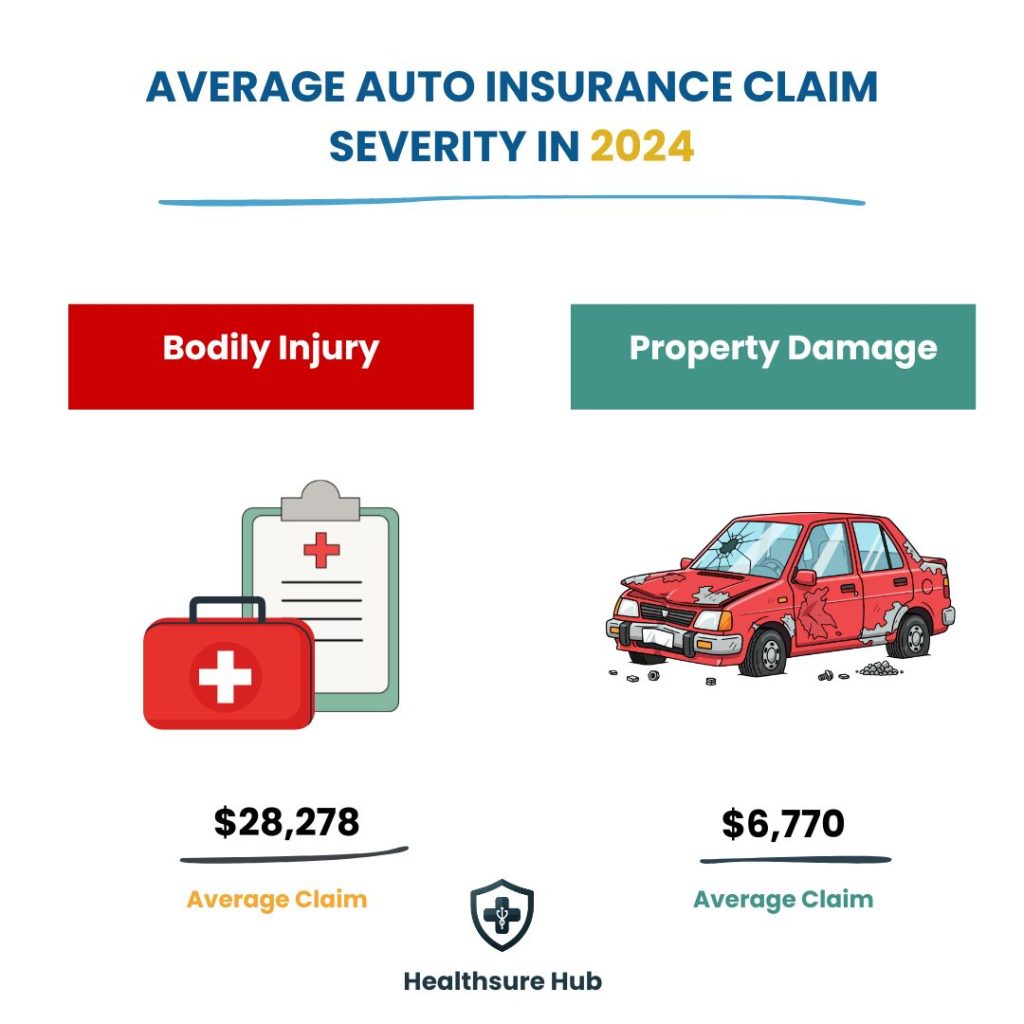
- Average claim severity in 2024:
- Bodily injury: $28,278
- Property damage: $6,770
Over the past decade, bodily injury claim frequency has gradually declined from 0.89% in 2015 to 0.80% in 2024, while severity has steadily increased, reflecting rising medical and legal costs. Property damage claim frequency has remained relatively stable, but average payouts have nearly doubled over the same period.
| Year | Bodily Injury Claim Frequency (%) | Bodily Injury Claim Severity ($) | Property Damage Claim Frequency (%) | Property Damage Claim Severity ($) |
| 2015 | 0.89 | 17,014 | 3.45 | 3,628 |
| 2016 | 1.04 | 16,082 | 3.41 | 3,969 |
| 2017 | 1.06 | 16,234 | 3.16 | 3,797 |
| 2018 | 0.94 | 18,213 | 3.09 | 4,174 |
| 2019 | 0.93 | 19,151 | 3.14 | 4,326 |
| 2020 | 0.78 | 20,769 | 2.39 | 4,703 |
| 2021 | 0.68 | 23,592 | 2.28 | 5,036 |
| 2022 | 0.70 | 24,681 | 2.54 | 6,024 |
| 2023 | 0.78 | 26,178 | 2.59 | 6,554 |
| 2024 | 0.80 | 28,278 | 2.50 | 6,770 |
Physical Damage Claims: Collision and Comprehensive
Collision and comprehensive insurance protect policyholders’ own vehicles. Collision covers accidents with other vehicles or objects, while comprehensive covers theft, vandalism, and natural events.
- Claim frequency in 2024:
- Collision: 4.16%
- Comprehensive: 3.95%
- Average claim severity in 2024:
- Collision: $5,489
- Comprehensive: $2,306
Although fewer drivers file collision claims than liability claims, the cost per claim is higher due to repair expenses. Comprehensive claims are slightly more frequent than collision for some model years but typically less costly.
| Year | Collision Claim Frequency (%) | Collision Claim Severity ($) | Comprehensive Claim Frequency (%) | Comprehensive Claim Severity ($) |
| 2015 | 6.01 | 3,377 | 2.62 | 1,679 |
| 2016 | 5.51 | 3,454 | 2.30 | 1,951 |
| 2017 | 5.98 | 3,517 | 2.86 | 1,811 |
| 2018 | 4.92 | 3,665 | 2.70 | 1,806 |
| 2019 | 5.00 | 3,828 | 2.99 | 1,796 |
| 2020 | 3.93 | 3,854 | 2.91 | 1,918 |
| 2021 | 4.31 | 4,583 | 3.35 | 1,947 |
| 2022 | 4.48 | 5,377 | 3.78 | 2,175 |
| 2023 | 4.48 | 5,521 | 4.08 | 2,305 |
| 2024 | 4.16 | 5,489 | 3.95 | 2,306 |
As per auto insurance claims statistics collision claim severity has climbed steadily over the past decade, reflecting inflation in parts and labor costs. Comprehensive claims remain more affordable but have grown slightly due to increased incidents of theft, weather events, and vandalism.
Trends in Overall Incurred Losses in Auto Insurance Claims Statistics
Examining total incurred losses reveals the financial impact of claims on insurers. Between 2020 and 2024:
- Private passenger auto liability losses grew from $81.6 billion to $132 billion.
- Physical damage losses increased from $54.6 billion in 2020 to nearly $90 billion in 2024.
- Commercial auto losses rose steadily, with liability losses hitting $33.5 billion in 2024.
| Year | Private Passenger Liability | Private Passenger Physical Damage | Commercial Liability | Commercial Physical Damage | Total Losses |
| 2020 | $81,627,769 | $54,659,175 | $19,279,909 | $4,824,642 | $160,391,495 |
| 2021 | $95,420,729 | $73,802,318 | $21,008,709 | $5,779,487 | $196,011,243 |
| 2022 | $118,106,320 | $91,033,128 | $26,227,343 | $7,669,261 | $243,036,052 |
| 2023 | $125,670,793 | $95,379,852 | $30,299,205 | $8,219,219 | $259,569,069 |
| 2024 | $132,012,369 | $89,499,857 | $33,572,686 | $7,968,725 | $263,053,637 |
Collision Losses by Vehicle Type in Auto Insurance Claims Statistics
Recent collision auto insurance claims statistics data demonstrates the impact of vehicle type on both claim frequency and severity:
| Vehicle Type | Claim Frequency (%) | Claim Severity ($) | Overall Loss ($ per vehicle year) |
| Passenger Cars | 7.2 | 10,298 | 737 |
| Pickups | 5.1 | 10,354 | 533 |
| SUVs | 5.5 | 10,220 | 562 |
| All Passenger Vehicles | 5.9 | 10,267 | 604 |
Passenger vehicles generally have higher claim frequency due to their numbers, while pickups carry higher severity per claim as noted in the latest auto insurance claims statistics. SUVs remain slightly lower in frequency but are costlier in repairs than compact cars.
Auto Insurance Costs
The cost of auto insurance is directly tied to claims frequency, severity, and driver behavior, making understanding these numbers crucial for both policyholders and insurers. Auto insurance premiums vary widely depending on location, vehicle type, driver demographics, coverage level, and even state regulations. Examining these costs helps drivers make informed decisions about coverage, while giving insurers insight into risk-adjusted pricing.
National Average Costs
With auto insurance premiums only increasing, full coverage auto insurance averaged at $2,697 in November last year. That’s about 12% higher than 2024, and 50% higher than in 2020.
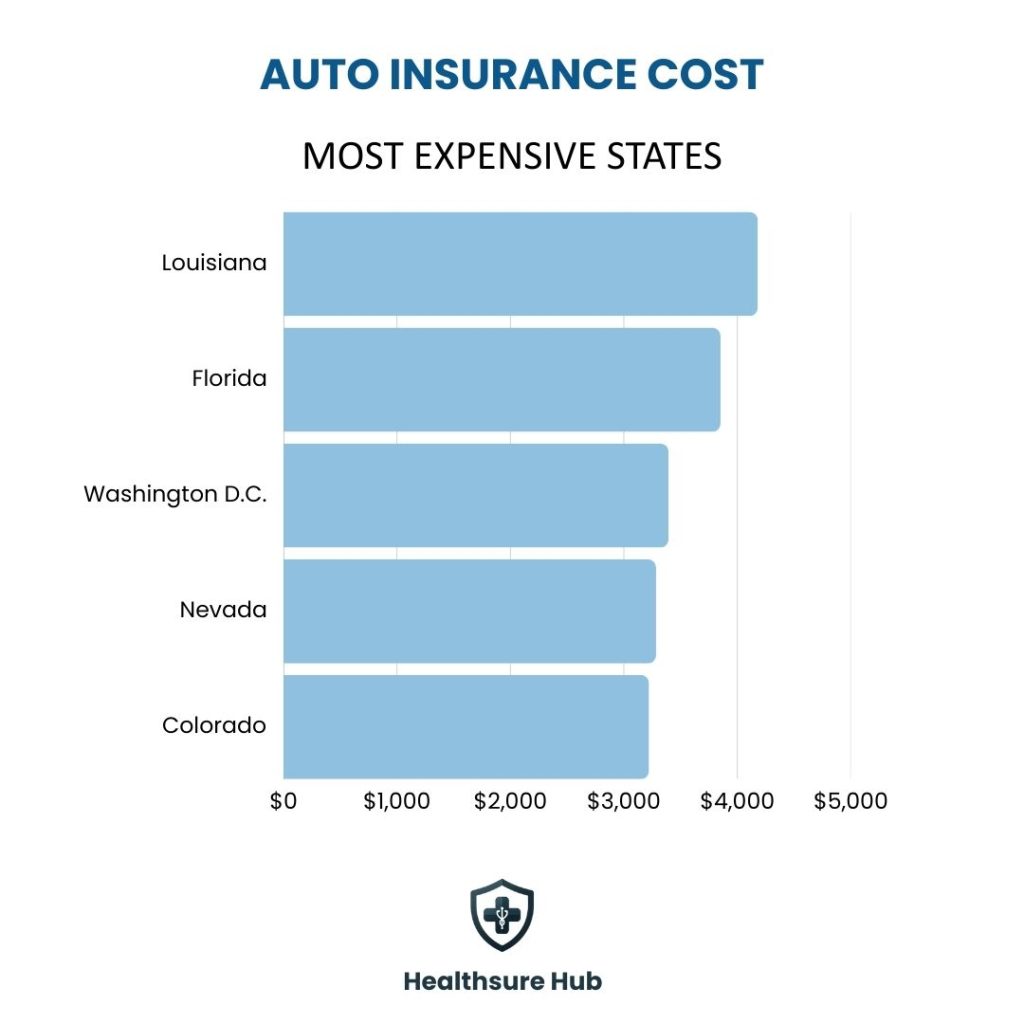
With the national average for full-coverage auto insurance at $2,697, several states exceed this benchmark by a noticeable margin. According to the latest auto insurance claims statistics, Louisiana’s average premium of $4,180 is about 55% higher than the national average, while Florida drivers pay roughly 43% more at $3,852. Washington, D.C., with an average premium of $3,394, comes in at approximately 26% above the national average. Nevada and Colorado are closer to the national norm but still elevated, with premiums 22% and 19% higher, respectively.
Overall, the data highlights meaningful regional disparities in auto insurance costs across the U.S.
Cost by State
Auto insurance premiums vary dramatically depending where you live. Your location plays one of the biggest factors for the cost of your auto insurance premium. As stated in the latest auto insurance claims statistics, this mainly depends due to local risk factors, including population density, traffic conditions, natural disasters, and state insurance laws. The following table summarizes average premiums in key states:
| Most Expensive States | Average Annual Premium ($) | Least Expensive States | Average Annual Premium ($) |
| Louisiana | 4,180 | Vermont | 1,504 |
| Florida | 3,852 | New Hampshire | 1,650 |
| Washington D.C. | 3,394 | Maine | 1.701 |
| Nevada | 3,284 | Hawaii | 1,721 |
| Colorado | 3,222 | Ohio | 1,739 |
According to Healthsure Hub’s auto insurance claims statistics, highest-cost states like Louisiana and Florida reflect high collision and liability claims, frequent hurricanes, and dense urban traffic. Lower-cost states like Vermont and New Hampshire benefit from lower traffic density, fewer accidents, and reduced natural disaster exposure.
Understanding state-specific factors is crucial for interpreting auto insurance claims statistics, as areas with higher claim frequencies often see increased premiums.
Cost by Vehicle Type
The type of vehicle you drive significantly influences premiums. Insurers assess risk based on repair costs, safety ratings, theft risk, and the likelihood of claims.
| Vehicle Type | Average Annual Cost ($) |
| SUVs | 2,526 |
| Sedan | 3,254 |
| Electric Vehicles (EVs) | 3,222 |
| Hybrid Vehicles | 3,126 |
EVs often carry higher premiums due to costly battery replacements and specialized repair parts, despite being involved in fewer accidents than ICE vehicles. Safety ratings also play a critical role: vehicles with high crash-test scores or advanced driver-assistance systems may qualify for discounts, reflecting a lower likelihood of claims.
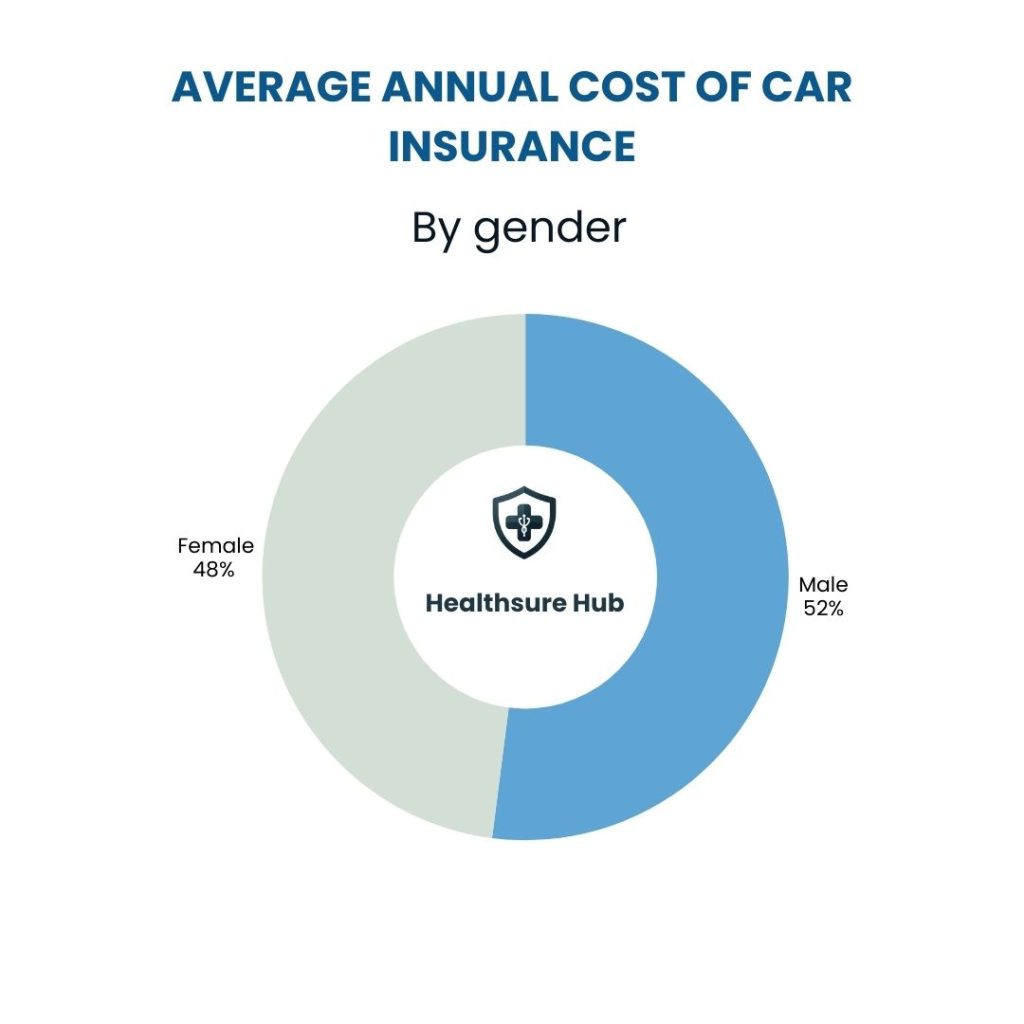
Cost by Age & Gender
Driver demographics are among the most predictive factors for auto insurance claims statistics, influencing both frequency and severity.
| Age Range | Average Annual Rate (Males) | Average Annual Rate (Females) |
| 16–20 | $6,257 | $5,901 |
| 21–24 | $4,768 | $4,434 |
| 25–29 | $3,408* | $3,243* |
| 30–39 | $2,844 | $2,807 |
| 40–49 | $2,707 | $2,687 |
| 50–59 | $2,498 | $2,473 |
| 60–69 | $2,455 | $2,424 |
| 70+ | $2,663 | $2,617 |
Teen drivers face the highest premiums due to inexperience and elevated accident rates. Young males generally pay more than females, reflecting statistically higher claim frequency and collision severity. While older drivers see lower claim frequency overall, premiums can rise slightly for those over 66 due to slower reaction times and increased injury severity in accidents as shown in the auto insurance claims statistics.
Cost by Coverage Type
Coverage selection dramatically affects auto insurance costs. The main types of coverage are liability, collision, and comprehensive:
- Liability covers damages to others if you’re at fault. It’s mandatory in most states and generally less expensive than full coverage.
Collision covers damage to your vehicle in a crash, regardless of fault. Costs vary based on vehicle type, repair costs, and local accident frequency. - Comprehensive covers theft, vandalism, weather, and other non-collision events, often paired with collision for full coverage.
| Coverage Type | Average Premium ($), 2020 | Claims Impact |
| Liability | 613 | High claim frequency, moderate severity |
| Collision | 371 | Frequent minor claims, moderate severity |
| Comprehensive | 174 | Low frequency, often high-cost claims (e.g., weather, theft) |
Selecting higher coverage limits or lower deductibles increases premiums according to auto insurance claims statistics but can reduce out-of-pocket costs when filing claims, balancing affordability with risk protection.
Conclusion
Auto insurance claims statistics provide critical insights into the risks, costs, and trends affecting drivers and insurers across the United States. Collision claims dominate filings, bodily injury claims remain the costliest, and states such as Florida and Louisiana experience the highest loss ratios.
With the rise of EVs, autonomous technology, and AI-driven claims processing, insurers and policyholders must adapt to a rapidly evolving landscape. By understanding claims data, consumers can make smarter coverage decisions, while insurers can refine pricing and risk strategies for profitability.
Sources:
https://www.insure.com/car-insurance/car-insurance-rates.html
https://www.bankrate.com/insurance/car/auto-insurance-rates-by-age/#age
https://www.forbes.com/advisor/car-insurance/average-cost-of-car-insurance
https://www.autoinsurance.com/research/auto-insurance-statistics-facts
https://www.iii.org/fact-statistic/facts-statistics-auto-insurance