Insurance call centers are the frontline of customer experience in the modern insurance industry. From handling claims to answering policy questions, they directly influence customer satisfaction, retention, and revenue. As insurers face increasing competition, insurance call center statistics reveal the benchmarks, challenges, and opportunities for maximizing efficiency and improving client loyalty.
We’ve compiled an article with the most relevant data-driven insights for insurance call centers statistics, making it the ultimate reference for decision-makers in insurance operations.
Top 5 Insurance Call Center Statistics Every Insurer Must Know
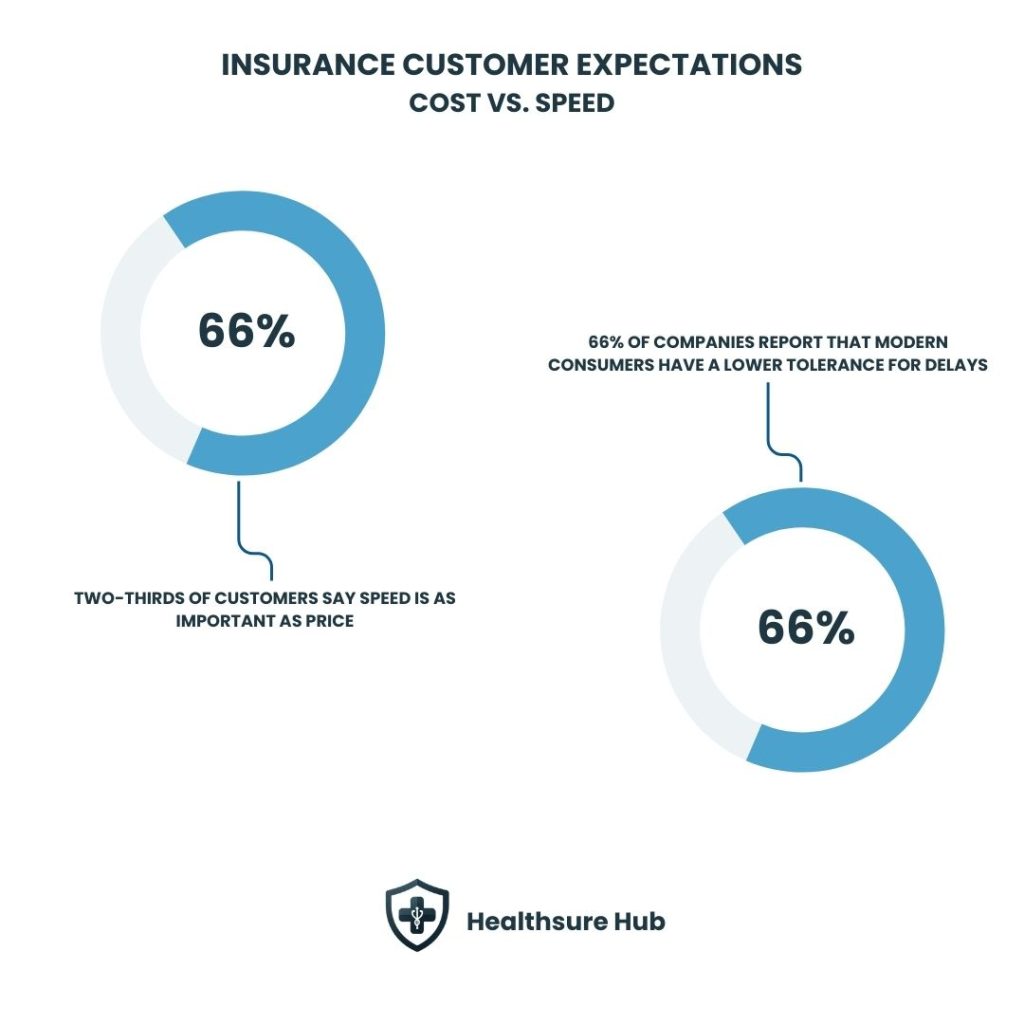
- Speed Matters as Much as Price – Two-thirds of customers (≈66%) say fast service is just as important as competitive pricing.
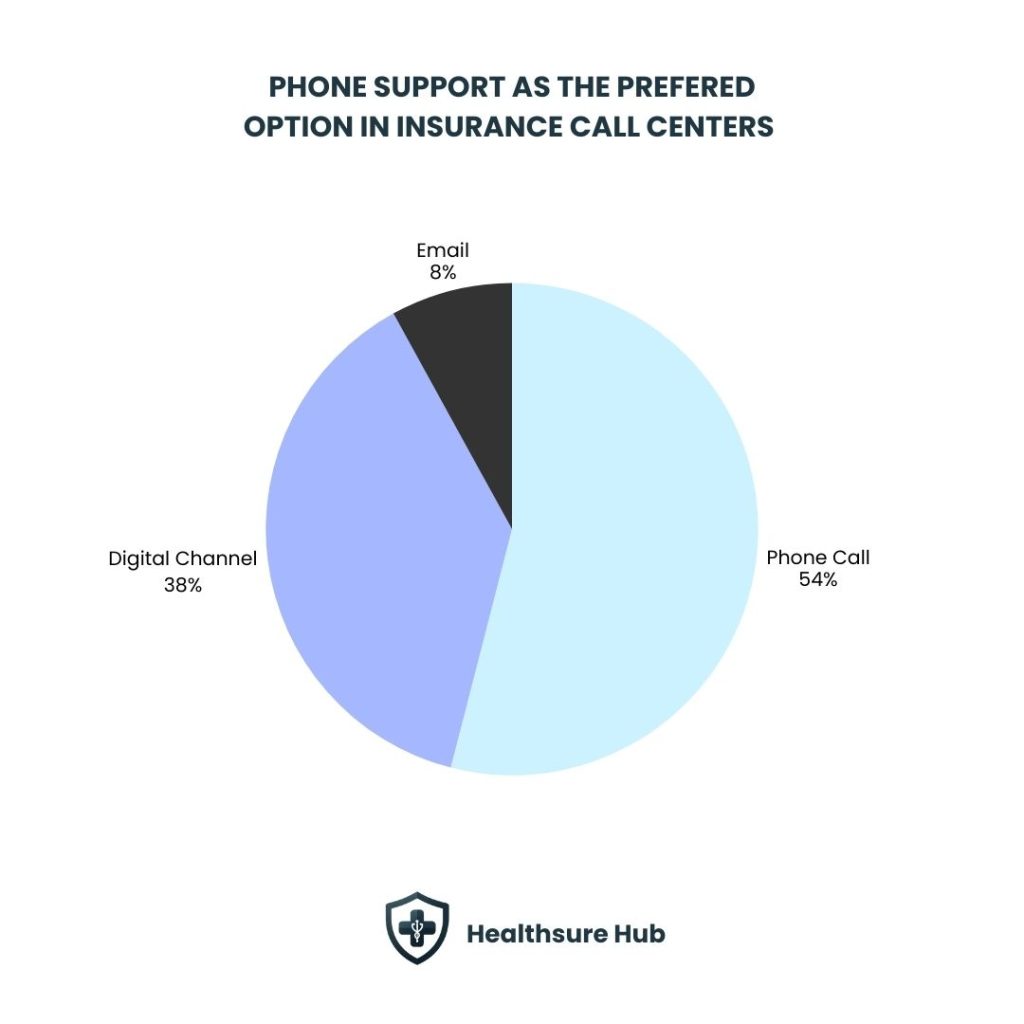
- Phone Remains King – Over 50% of U.S. customers prefer phone support when resolving insurance issues.
- Customer Retention Soars with Quality Service – Personalized call center experiences lead to an 81% increase in customer retention.
- AI Automation Boosts Efficiency – AI can reduce operational work by up to 40%, allowing agents to focus on complex calls.
- Customer Patience is Declining – 66% of companies report that today’s customers are less patient, making first-call resolution more critical than ever.
Insurance Customer Expectations
Speed vs. Cost
Customers today are less patient than ever. According to a 2023 study by Jay Baer, two-thirds, or around 66% of customers say speed is as important as price. Additionally, 66% of companies report that modern consumers have a lower tolerance for delays. For insurance call centers, this means that optimizing response times is critical. Long wait times or multiple call transfers can directly impact customer retention and satisfaction, as highlighted in recent insurance call center statistics.
Preferred Channels
Despite digital transformation, phone support remains the most preferred method, with over 50% of U.S. customers relying on it for insurance inquiries, followed by 38% preferring other digital channels and only 8% communicate through mail. Industry projections show that 89% of companies expect phone support to remain essential for the foreseeable future, reinforcing its role as a primary channel for urgent issues such as filing claims or roadside assistance requests. Integrating specialized support for areas like in the life insurance industry or dental insurance ensures agents can handle product-specific questions efficiently. These insights are reflected in the latest insurance call center statistics.
Omnichannel Needs
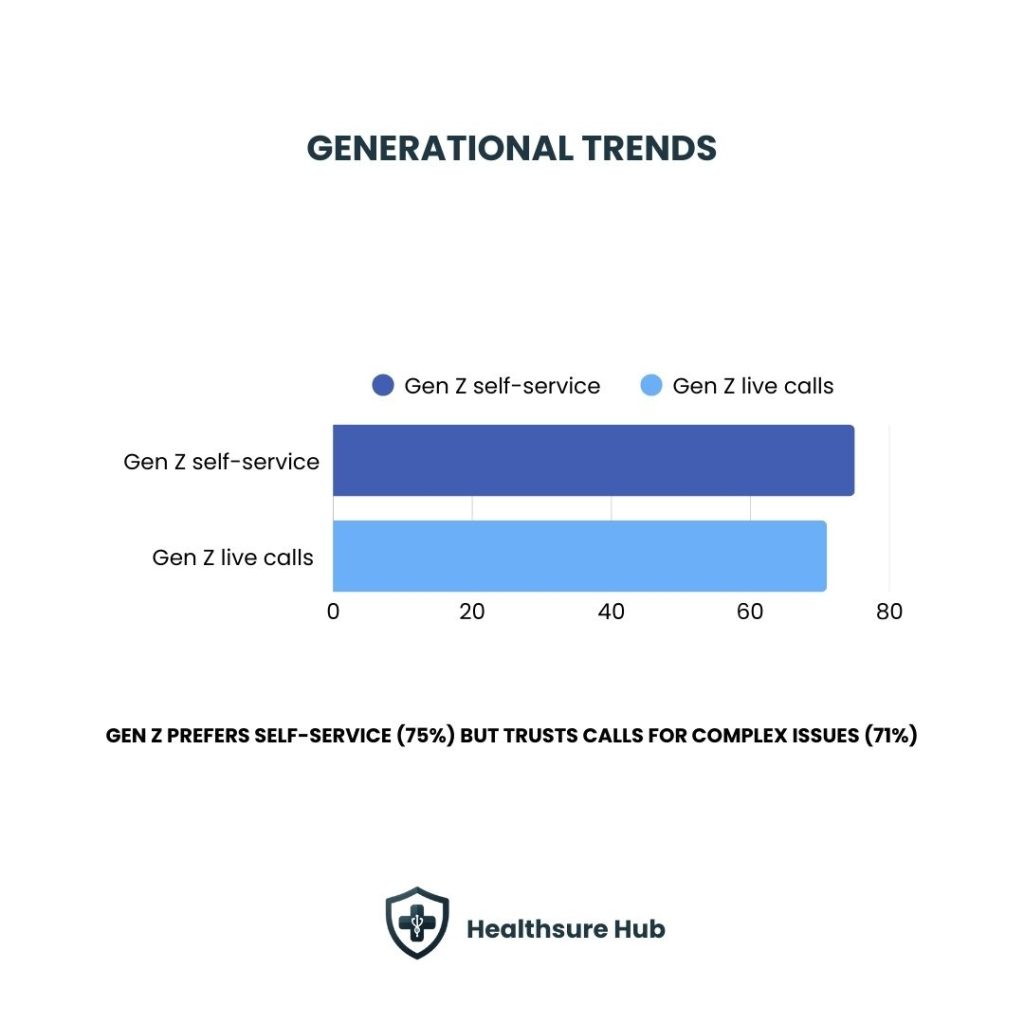
Policyholders expect seamless transitions across channels, whether mobile apps, chatbots, or emails. Generational trends show that Gen Z prefers self-service (75%) but still considers live calls the easiest way to resolve complex insurance issues (71%). Insurance call center statistics highlight that integrating omnichannel solutions improves customer experience and reduces call escalation
Call Center Volume & Workload
Insurance call centers manage high call volumes, averaging ~4,400 monthly calls, including claims, billing questions, and policy inquiries. With increasing demand, agents handle more interactions in less time, while maintaining an average schedule adherence rate of 80%.
Additionally, 47% of insurance inquiries occur outside standard business hours. That means if your insurance agency closes at 6 p.m. and doesn’t reopen until 10 a.m. in the morning, you miss out on over 50% insurance inquiries.
This only emphasizes the need for flexible staffing to ensure high-quality service during peak and after-hours periods. These numbers are part of critical insurance call center statistics for staffing optimization.
Key Performance Metrics for Insurance Call Centers
To measure efficiency and customer satisfaction, the following KPIs are critical:
- Customer Satisfaction Score (CSAT) – 75–85% considered good
- First Call Resolution (FCR) – >70% is ideal; critical for claims processing
- Average Handle Time (AHT) – ~6 min 10 sec; longer due to verification processes
- Average Speed of Answer (ASA) – Target ≤28 seconds
- Abandonment Rate – <5% ideal; insurance may experience slightly higher rates
- Occupancy Rate – 85–90%
Tracking these metrics allows insurance call centers to benchmark performance, identify bottlenecks, and align staffing and automation strategies, as shown in current insurance call center statistics.
Personalization & Customer Retention
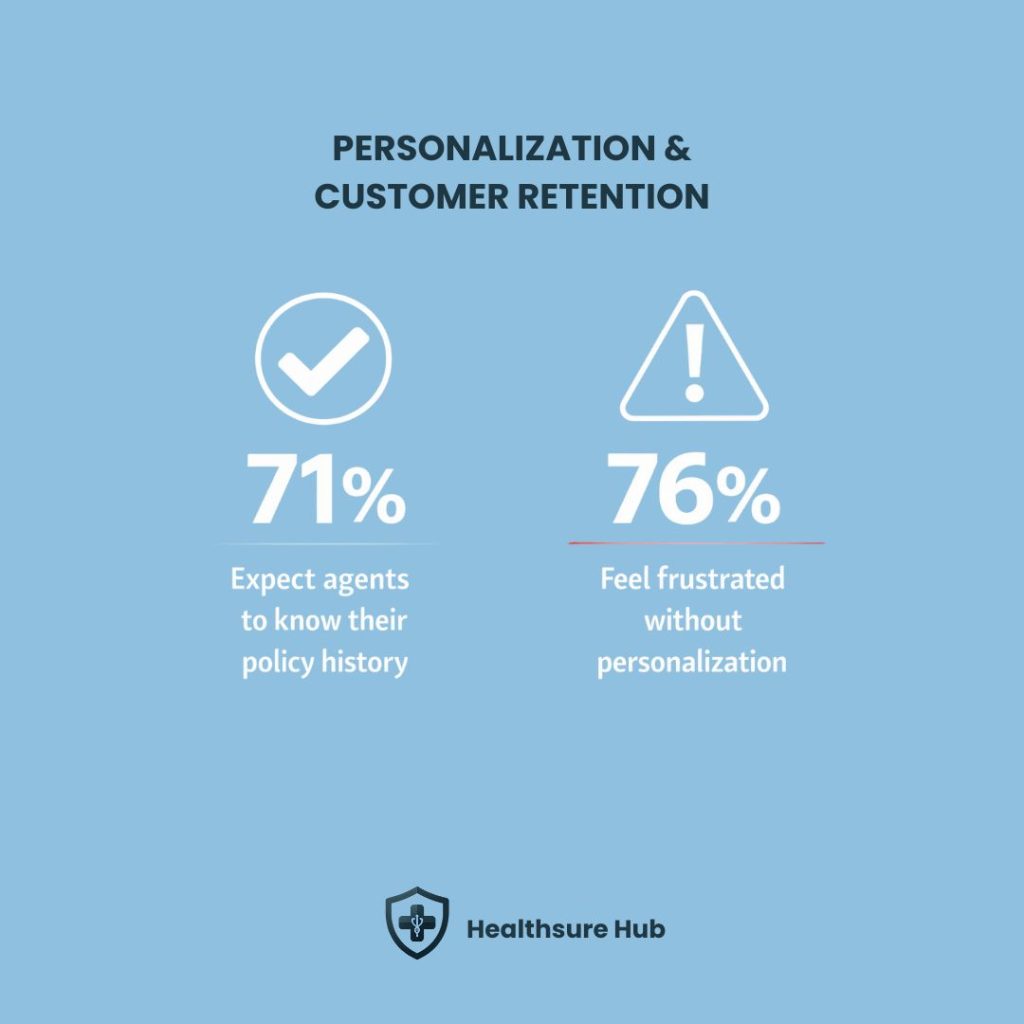
Personalized interactions drive loyalty. 71% of customers expect agents to know their policy history, while 76% report frustration without personalization. Insurance call centers that implement tailored support can achieve an 81% increase in customer retention, highlighting the direct link between call center performance and long-term revenue. Using CRM systems and integrating historical policy data ensures agents can deliver highly contextual responses.
The Role of AI & Automation
Automation is transforming insurance call centers:
- Operational Work Reduction – AI can cut up to 40% of routine tasks
- Cost Savings – Operating costs can decrease by 30–40% without adding staff
- Efficiency Gains – Repetitive tasks handled faster, reducing AHT and errors
- Reduced Repeat Calls & Rework – AI ensures consistent workflows, improving first-call resolution
- Scalable Service Capacity – High-volume interactions handled without increasing headcount
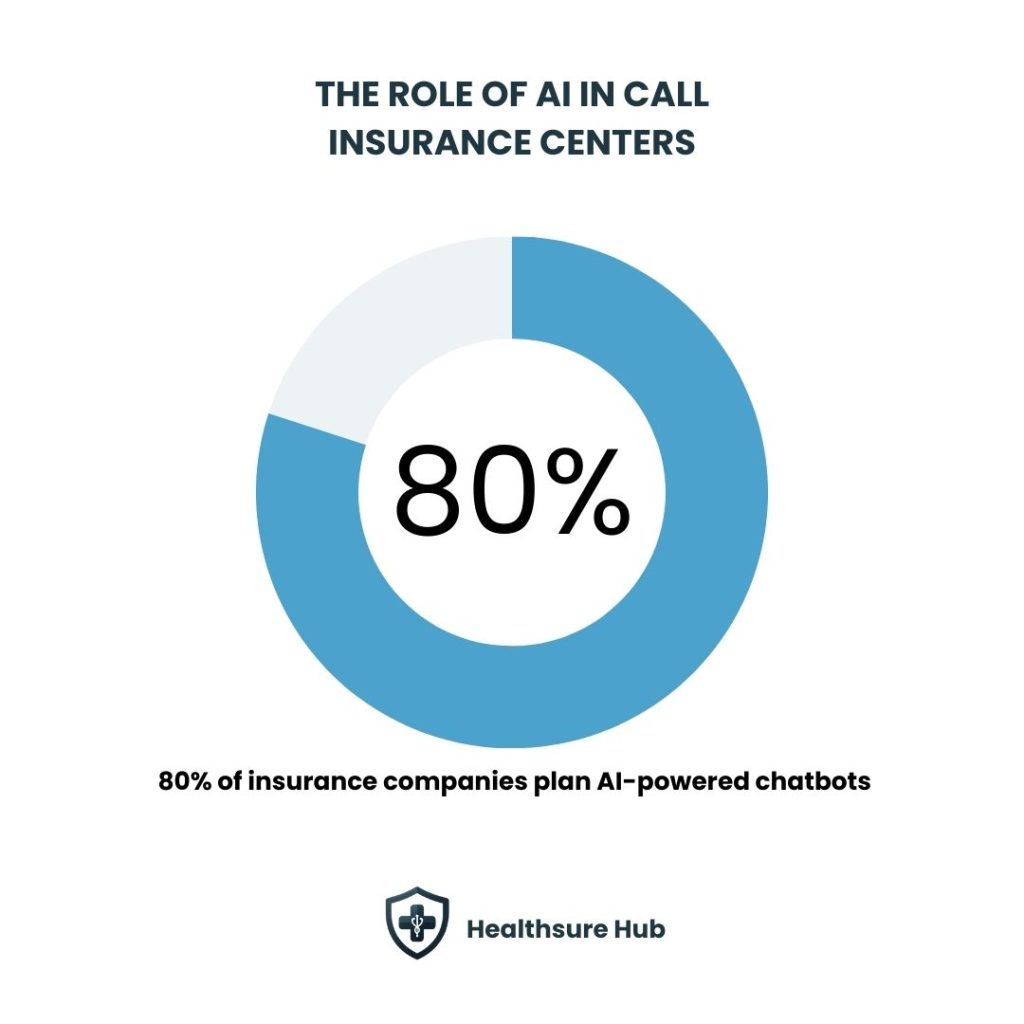
Common AI applications include automated claim submissions, policy lookup, FAQ handling, and routing to specialists. 80% of companies plan AI-powered chatbots, demonstrating automation’s role in boosting efficiency and customer satisfaction.
Lead Conversion & Revenue Impact
Call centers directly influence revenue:
- Quote Shopping Behavior – 78% of consumers call multiple agencies; first call response is crucial
- First Call Conversion – The first center to answer is 35–50% more likely to close
- Revenue Impact – Each missed call represents $1,547 in potential annual premium revenue
Tying these stats to call center KPIs such as Abandoned Call Rate, ASA, and Occupancy Rate allows insurers to quantify opportunities and losses.
Benchmarking & Industry Insights
Comparing top-performing insurance call centers with industry averages offers actionable insights:
- High-performing centers maintain FCR >70% and CSAT >80%
- Abandonment rates are minimized through optimized staffing and AI-assisted workflows
- Effective omnichannel integration reduces call transfers and escalations
Tying these stats to call center KPIs such as Abandoned Call Rate, ASA, and Occupancy Rate allows insurers to quantify opportunities and losses, as evidenced by insurance call center statistics
Conclusion
Insurance call center statistics clearly demonstrate that speed, personalization, and AI adoption are the primary drivers of customer satisfaction, retention, and revenue. Fast first-call resolution, strong phone and omnichannel support, and AI-driven automation directly improve customer satisfaction, retention, and revenue. Optimizing these areas ensures call centers handle high volumes effectively while minimizing missed opportunities and maximizing loyalty.
Sources:
https://www.zendesk.com/blog/customer-service-agent-recognition
https://www.statista.com/statistics/818566/preferred-channels-customer-service-issues-united-states/
https://www.cmswire.com/contact-center/16-important-call-center-statistics-to-know-about
https://www.sprinklr.com/blog/call-center-statistics
https://agentzap.ai/blog/insurance-agency-phone-statistics
https://www.liveagent.com/blog/call-center-statistics
https://convin.ai/blog/insurance-call-automation-customer-satisfaction
https://market.biz/call-center-statistics
https://agentzap.ai/blog/insurance-agency-phone-statistics