Revenue cycle management statistics reveal how dramatically the financial landscape of healthcare has evolved. 2025 changed a lot of things in the RCM industry. What was once seen as a back‑office administrative function has become a critical barometer of organizational health. Today, manual process handling is no longer financially viable and claim denial rates are at a constant of 5%.
Interested in learning more about revenue cycle management statistics? Here’s our team’s take of the most important findings and provides an integrated view of the latest RCM statistics that matter in 2026.
RCM Market Growth: Size, Adoption & Trends
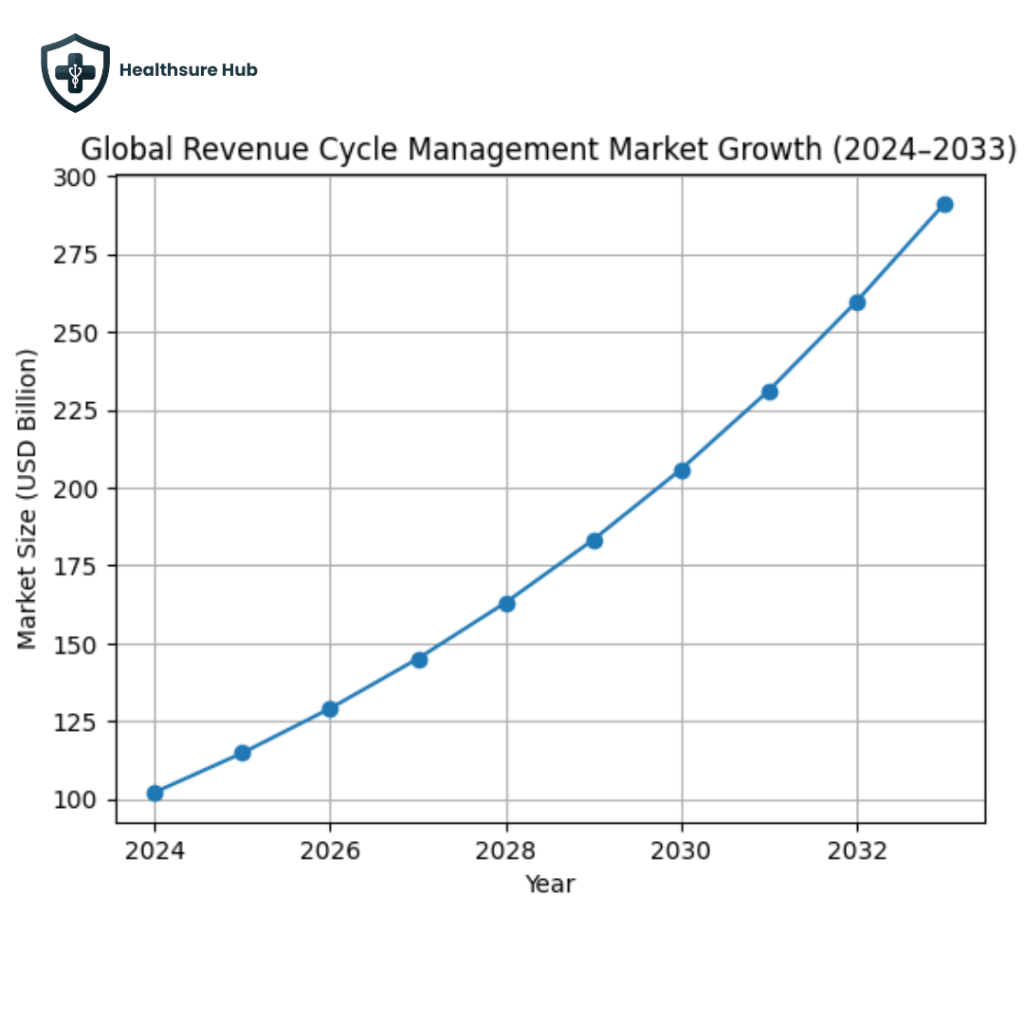
The global market for revenue cycle management expanded rapidly through the early 2020s, driven by increased adoption of cloud solutions, analytics, and automation platforms. One market analysis estimated the global revenue cycle management market at approximately around $102.16 billion in 2024, with projections reaching nearly $291 billion by 2033, reflecting a compound annual growth rate (CAGR) of around 12.4% during 2025–2033.
In the United States, revenue cycle management growth has followed a similar trajectory. While market sizing varies depending on whether estimates include software alone or both software and services, most analyses agree that the U.S. RCM market represents tens of billions of dollars annually. Continued expansion is expected as healthcare providers replace fragmented legacy systems with integrated, end-to-end platforms.
These revenue cycle management statistics point to a structural shift: RCM is no longer a support function, but a core financial infrastructure supporting billing, claims, collections, and payer engagement
Claim Denials & Their Financial Impact
Across revenue cycle management statistics from 2024–2025, claim denials emerged as one of the most persistent cost drivers. Multiple industry reports found that initial claim denial rates rose to roughly 11.8% by 2024, with many providers reporting denial rates of 10% or higher.
Another survey found that nearly 41% of providers reported denial rates of at least 10% on submitted claims, a figure that places denial exposure well above typical operational targets.
Estimates indicate that even in broader, industry‑structured analysis on revenue cycle management statistics regarding claim denials show that 5-10% of healthcare claims are denied annually, that represents a loss of up to $262 billion annually (based on historical data with continued relevance to the scale of the issue).
These denial trends have significant financial implications: denied claims not only delay cash flow but also require additional administrative handling, often multiple appeals and rework cycles before payment.
Core RCM Performance Benchmarks
A broad set of revenue cycle management statistics are used to assess operational health and financial performance. These include:
- Net Collection rate (NCR) – common benchmarks for NCR range from 95% to 99% for high‑performing entities, with industry averages closer to the mid‑90s.
- The average denial rate– denied inpatient claims rising 12% and outpatient claims 14% year-over-year.
- Days in accounts receivable – industry averages often fall in the 30–40 day range, with top performers pushing toward shorter periods (<25 days).
- Clean claim rate (CCR) – clean claim rates describe the percentage of claims accepted by payers on first submission; most benchmarks show above 95% as a key indicator of efficient front‑end processes.
- Cast to collect- revenue cycle cost to collect is frequently reported as a percentage of revenue. Benchmark data has shown averages around 2–4% of net patient revenue, with lower figures indicating more efficient operations.
- Collection rate and patient payment- live benchmarks list overall collection rates around 95.8%, with top quartile providers exceeding 98%.
These revenue cycle management statistics offer snapshot insights into how effectively organizations turn services into payable revenue, track outstanding obligations, and minimize financial leakage.
Administrative Costs & Workforce Analytics
Administrative expense remains one of the largest internal cost centers in healthcare finance. Revenue cycle management statistics consistently show that manual workflows are associated with higher labor intensity, increased error rates, and slower reimbursement cycles.
Workforce challenges further complicate this picture. Turnover, staffing shortages, and burnout directly affect eligibility verification, claims follow-up, and payment posting timelines. As staffing pressure increases, organizations often experience rising days in A/R and higher abandonment rates for denied claims.
These trends reinforce the role of revenue cycle management statistics as indicators not only of financial performance, but also of operational strain.
Patient Financial Responsibility & Cash Flow
Across recent RCM data, patient responsibility, meaning the portion of revenue owed directly by patients after insurance, has become a more prominent component of total healthcare revenue. One major trend showed patient payment responsibilities growing to represent between 35–40% of revenue in many practices, reflecting broader shifts in reimbursement structures and high‑deductible health plans.
This shift has materially altered cash flow dynamics. Patient balances typically take longer to collect, are more sensitive to communication and billing clarity, and contribute disproportionately to A/R aging.
As a result, revenue cycle management statistics related to patient collections, payment velocity, and self-pay balances have become central to financial performance analysis.
Automation, Digital Adoption & Technology Trends
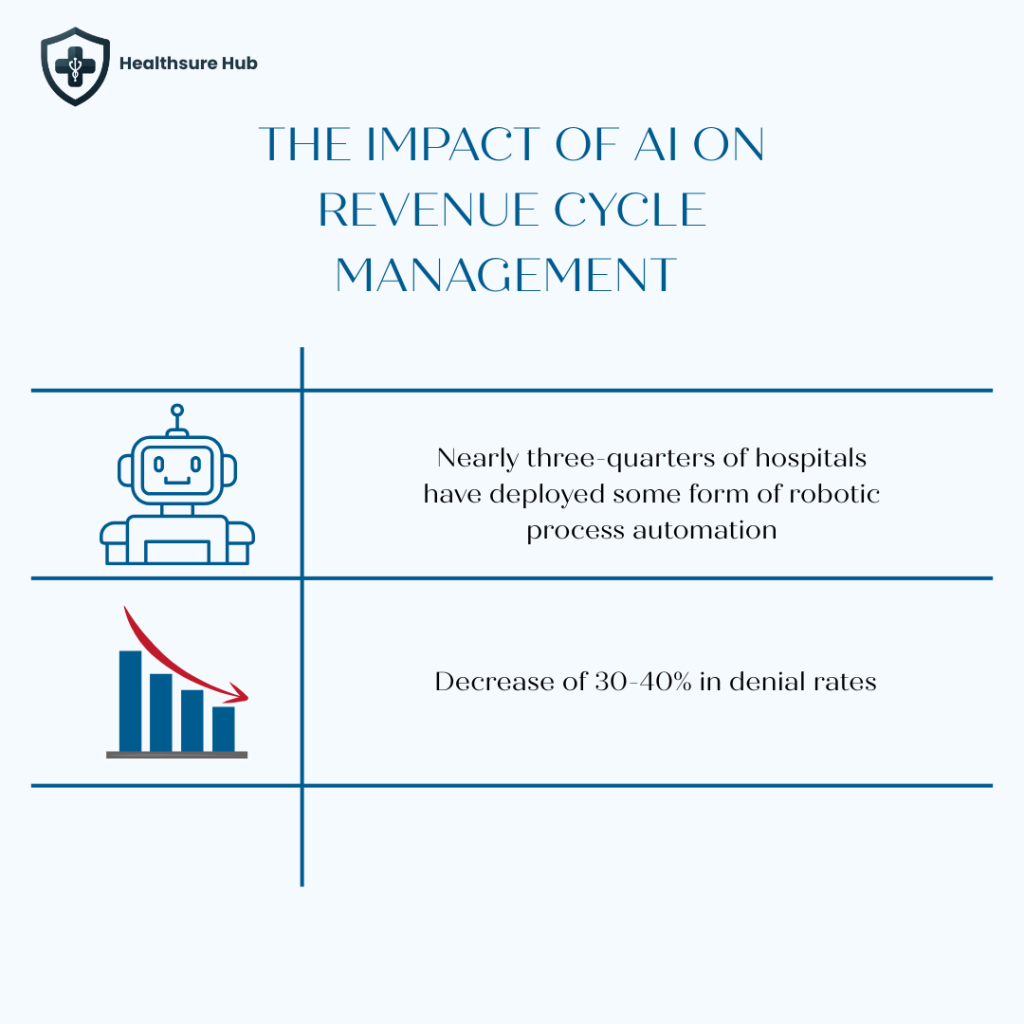
By 2025, automation and AI had become embedded across many revenue cycle operations. Industry surveys suggest that nearly three-quarters of hospitals have deployed some form of robotic process automation or AI within the revenue cycle. RCM teams in 2025 are using advanced analytics and AI to anticipate problems before they happen. Predictive tools now help forecast revenue trends, identify at-risk claims before submission, and optimize financial workflows in real time. This shift represents a move toward smart, data-informed revenue cycle performance rather than traditional manual review processes.
However, revenue cycle management statistics from CAQH indicate that significant inefficiencies remain. Approximately 22% of administrative spending is still tied to workflows that could be fully automated using existing electronic standards.
As adoption matures, the industry has shifted away from broad experimentation toward focused, high-impact applications. Predictive denial identification, automated claim scrubbing, intelligent worklist management, and document classification have emerged as the most common use cases.
Digitally mature organizations report that AI-driven tools now manage over 57% of eligibility workflows, with associated reductions of 30-40% in denial rates and measurable decreases in labor cost per claim. These revenue cycle management statistics highlight a widening performance gap between organizations with advanced digital infrastructure and those relying on legacy systems.
Conclusion
Taken together, the latest revenue cycle management statistics depict an industry undergoing structural transformation. Market growth remains strong, driven by digital adoption and operational complexity. Claim denials continue to exert financial pressure, while administrative costs and workforce challenges shape internal performance.
At the same time, patient financial responsibility has emerged as a dominant influence on cash flow, and technology adoption is redefining how revenue cycle operations function at scale. In this environment, revenue cycle management statistics are no longer peripheral metrics; they are essential indicators of financial stability and organizational resilience heading into 2026.
Sources:
https://www.serbinmedicalbilling.com/ask-caryl-calculating-and-understanding-days-in-a/r
https://www.medicalbillersandcoders.com/blog/net-collection-ratio-benchmarks-multi-specialty-groups
https://flobotics.io/blog/revenue-cycle-management-metrics
https://assets.asccommunications.com/whitepapers/cloudmed-wp-february-2022.pdf